DATA VISUALIZATION

Overview
Visualizing the information and data of faculty of design at Ohio State University for the 50th anniversary of the Department of Design Exhibition.
Year
2018
My Role
Researcher, Designer , Data Analysis, Prototyping
Tools
Tableau, Adobe suite, Sketch
Team Size
1 member
PROJECT DEFINITION
Celebrating the 50th anniversary of the Ohio state Department of Design at the Urban Arts Space to visualize the department’s history.
Design department was celebrating the 50th anniversary of the department. The goal of this project was to visualize the most important and interesting data about faculty, distinguished alumni, and general information about history of the department. The exhibition took place at the Urban Arts Space, and more than 200 people visited this event.


PROCESS SUMMARY
The process started with sketching and gathering the data. I was trying to experiment with both innovative and traditional ways of showing data. I took the information to tableau and started first processes and visualizations in this environment. However, eventually I ended up with final versions that were combination of tableau and Illustration skills.
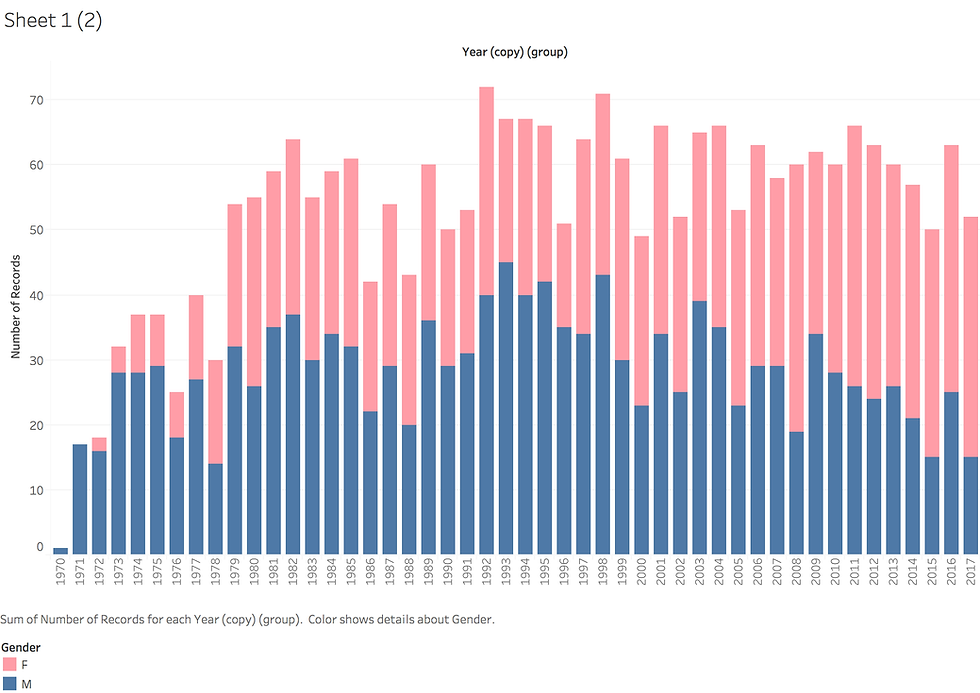
ANALYZING THE DATA
In addition to doing the research into the history of the department, another aspect of this project included analyzing the information and presenting them in an engaging format.